Dashboard Templates
Dashboard templates let you design custom layouts for dashboards using a (DOCX) Word document. You create a Word file with one or more tables and insert special placeholder tokens (like {{COMPONENT_#}}) inside table cells. When the dashboard runs, Unaric Reports replaces these tokens with the actual dashboard components (charts, tables, metrics) and data.
This works very similarly to report templates, but is tailored for dashboard layouts.
How it works
- Everything is placed inside tables in your Word document.
- The position and size of components are determined by where you put the placeholders in the table cells.
- Components are numbered starting from 1 ({{COMPONENT_1}}, {{COMPONENT_2}}, etc.). The numbering order (indexing) depends on whether you're building for Classic Dashboards or Lightning Dashboards:
Grid-based (can be less predictable due to responsive layout). Use the info button on the Run Dashboard page to see the exact indexes displayed on your preview.
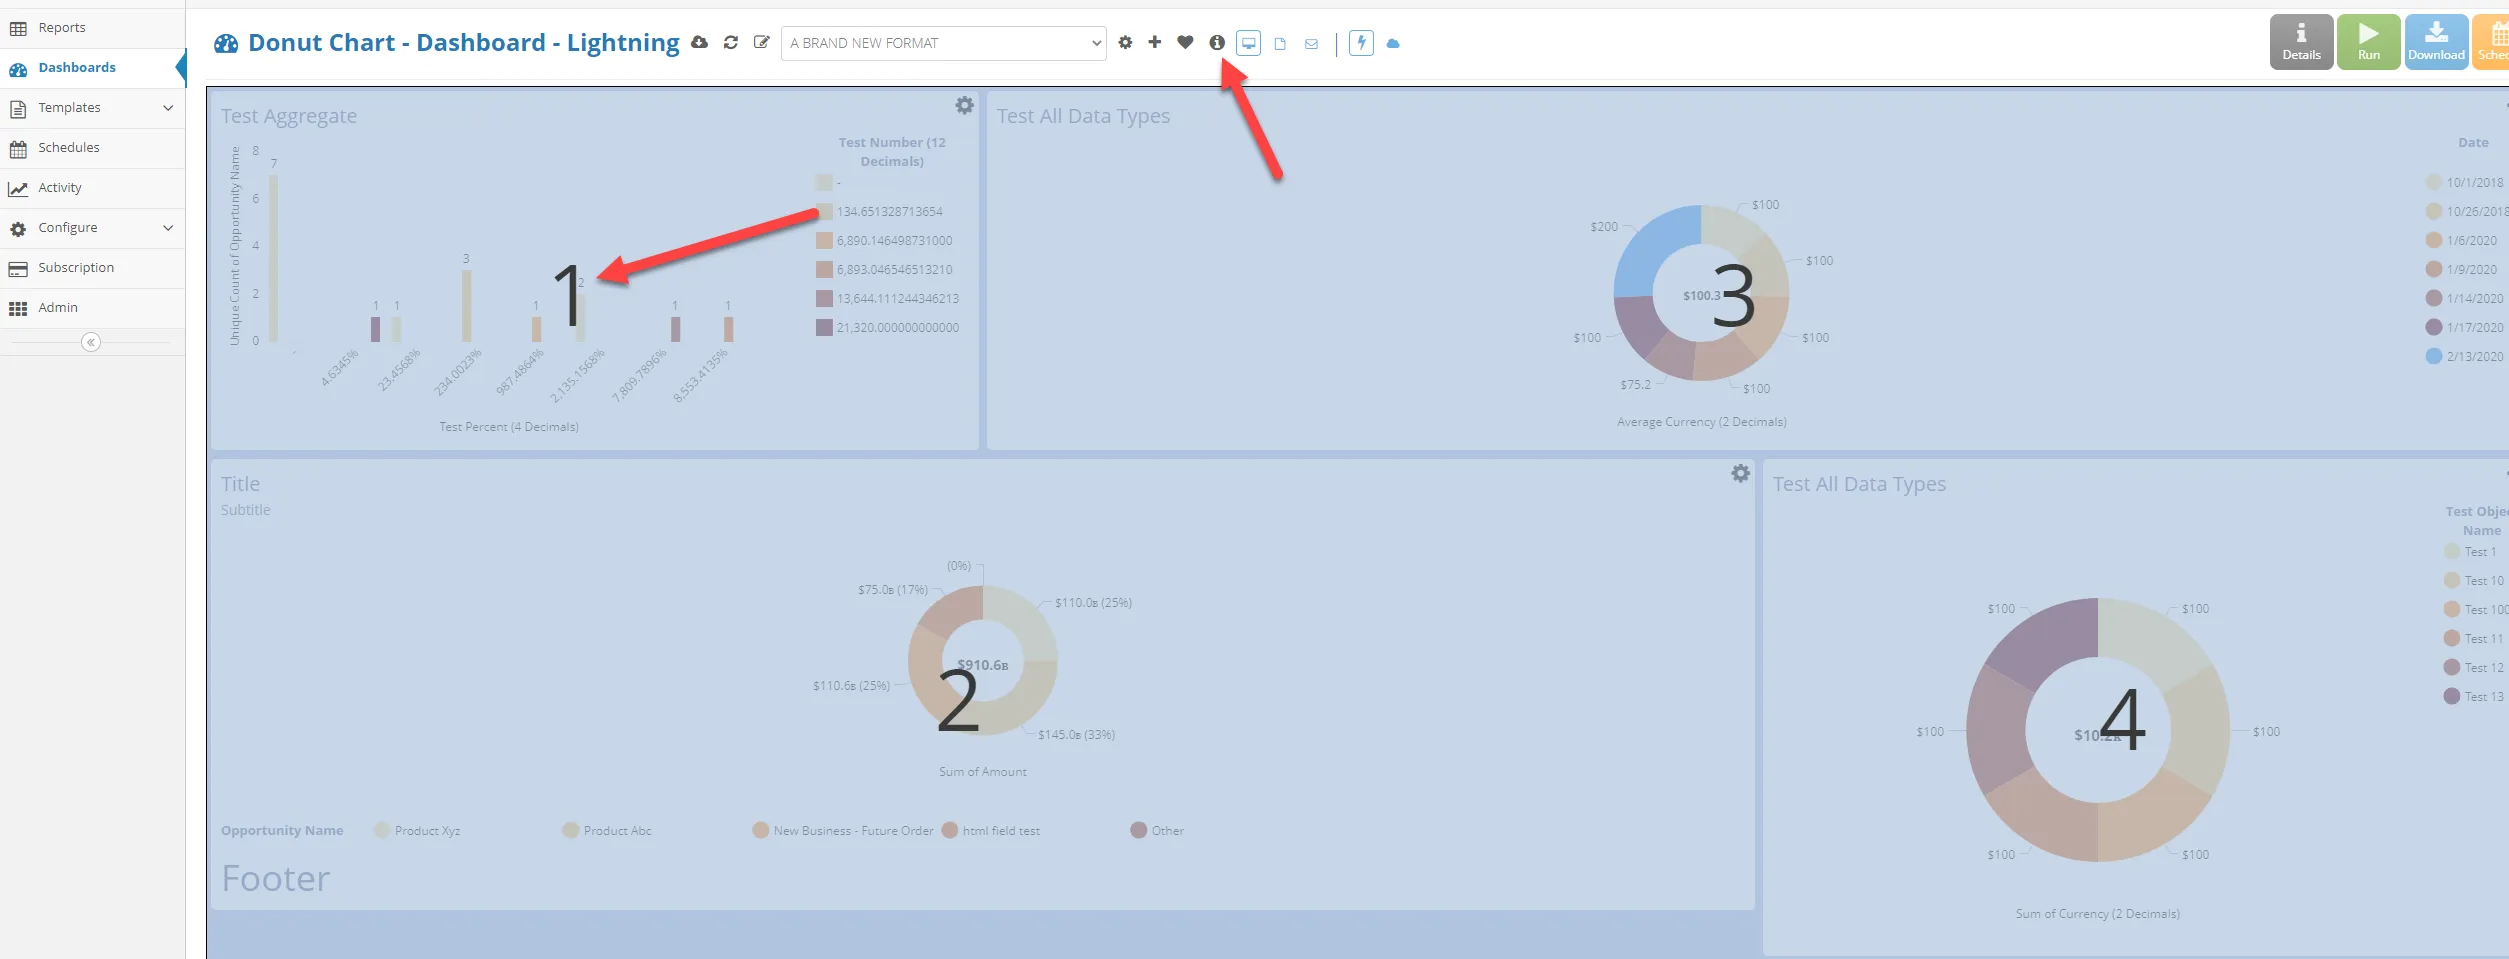
Components
Component types
A. Charts The main visual building blocks (bar, line, pie, etc.).
- Use {{COMPONENT_#}} + any of the title/header/subtitle/footer tokens above.
- No extra tokens needed beyond positioning and labels.
B. Tables Simplified dashboard tables (only tabular and only contain a header and data rows). Supported tokens (same as report templates – see Report Templates help for details):
- {{HEADER_ROW}}
- {{DATA_ROW}}
- {{ALTERNATING_DATA_ROW}} (for striped rows)
C. Metrics (single KPI / summary values) Place these tokens inside a table cell or directly in a paragraph within the table:
- {{METRIC_LABEL}} → Field name (e.g. "Total Opportunities")
- {{METRIC_VALUE}} → Formatted number (e.g. "142")
Add components
Use this main token inside any table cell to define a component's position:
- {{COMPONENT_#}} (# = 1, 2, 3…) This marks where the chart, table, or metric should appear.